Conflation Framework
To create a comprehensive and attribute-rich building stock dataset, EUBUCCO utilizes a multi-stage geospatial conflation pipeline. This process integrates fragmented datasets — authoritative governmental data, volunteered geographic information (OpenStreetMap), and ML-derived footprints (Microsoft) — into a single, non-redundant database.
The framework follows a strict hierarchy prioritizing sources with higher footprint precision and attribute quality.
- Governmental Data
- Volunteered Data (OpenStreetMap)
- ML-derived Data (Microsoft Building Footprints)
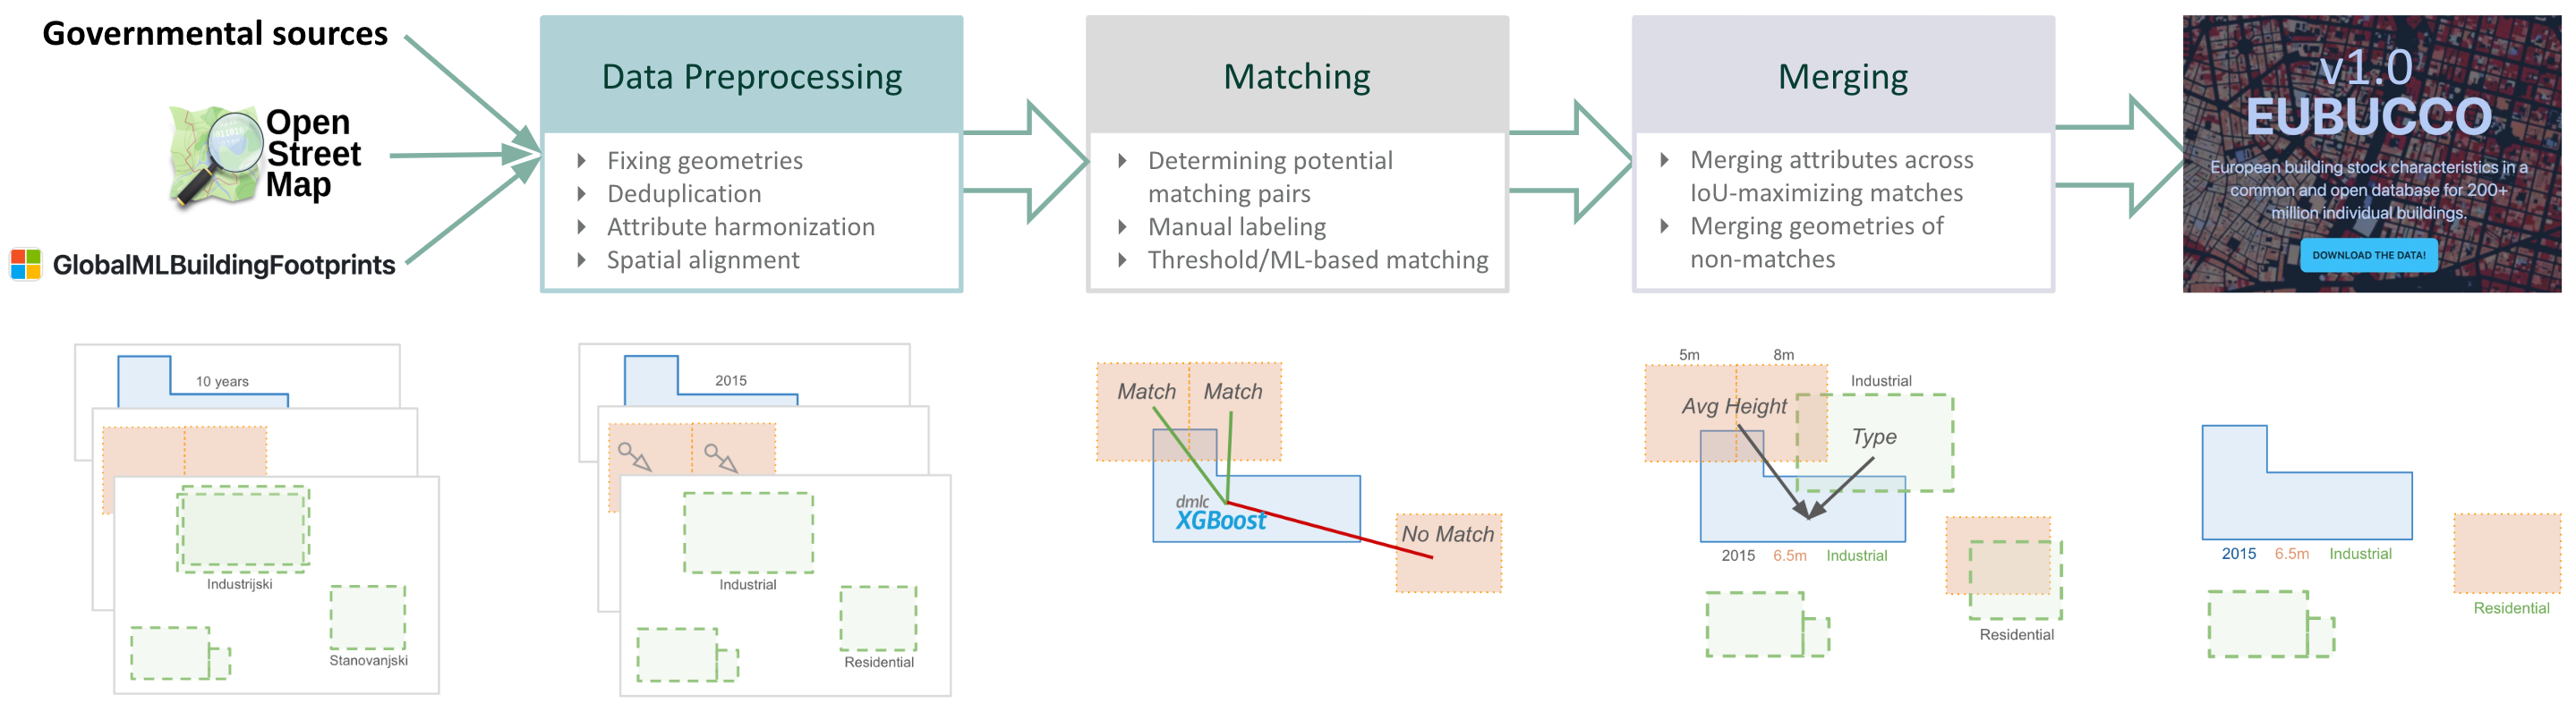 Figure 1: Overview of the EUBUCCO conflation pipeline, illustrating the journey from raw disparate sources to a harmonized, merged building database.
1. Data Preprocessing
Before matching, data must be harmonized and cleaned to ensure spatial and semantic consistency across all inputs.
Spatial Alignment (Rubbersheeting)
Datasets often exhibit systematic local shifts. We apply a localized rubbersheeting method to correct positional discrepancies.
- Landmark Identification: Reciprocal nearest neighbors are identified within a 25m threshold.
- Offset Estimation: Neighborhood-level offsets are calculated using H3 grid cells (Resolution 9).
- Correction: A uniform affine translation is applied to buildings within cells where systematic shifts are detected, correcting offsets >1m in 53% of cases.
Deduplication and Repair
Internal consistency is enforced within each source to remove redundant footprints:
- Geometry Repair: Invalid or "broken" geometries are fixed or removed.
-
Deduplication: We remove buildings that significantly overlap with others in the same dataset. If the IoSA exceeds a tolerance threshold of 0.25, the building with the smaller area is discarded.1
\[\text{IoSA}(a, b) = \frac{|a \cap b|}{\min(|a|, |b|)}\]where \(|\cdot|\) denotes the surface area.
Attribute Cleaning and Harmonization
Raw attributes are often noisy or follow local schemas. We implement a rigorous cleaning pipeline:
- Outlier Removal: Unrealistic values are filtered out, such as building heights \(>350m\), floor counts \(>100\), or cases where the floor-to-height ratio suggests a floor height \(<1.5m\). Construction years are extracted and clipped to a valid range (i.e. 0–2029).
- Use Type Harmonization: Source-specific tags are mapped to a harmonized use-type classification. This process includes the removal of non-building structures (e.g., traffic areas, radio masts, or underground structures) based on their source classification.
2. Matching
The core of the conflation process is identifying which footprint geometries from different sources refer to the same real-world structure.
Candidate Selection
To manage computational complexity, we employ a symmetrical k-nearest neighbors (k-NN) search. For every building, we identify the top k=3 potential matches in the secondary dataset within a defined distance threshold and vice-versa.
Machine Learning Classifier
Unlike traditional methods that use simple "rule-of-thumb" intersection thresholds (like IoU > 0.5), EUBUCCO employs a state-of-the-art XGBoost classifier to assess whether two footprint geometries refer to the same real-world structure.
- Features: The model is trained on 87 geometric and contextual features, including intersection metrics, shape characteristics (elongation, convexity), and spatial context (neighbor density).
- Performance: This framework achieves an F1-score of 99.7%, significantly outperforming traditional intersection-based heuristics which often miss 12–57% of true matches.
| Feature Group | Examples |
|---|---|
| Intersection | IoU (Intersection over Union), IoA (Intersection over Area), IoSA , Aligned Area Overlap |
| Shape | Perimeter, Squareness, Corner Count, Longest Axis, Elongation, Convexity |
| Similarity | Centroid Distance, Wall Alignment, Shared Wall Length, Hausdorff Distance |
| Contextual | Neighbor counts (5m to 50m), Average alignment in neighborhood, Local density metrics |
3. Merging
Once matches are identified, the geometries and attributes are integrated to produce the final building record.
Attribute Merging
For each target building \(a\), we combine the attributes (Type, Height, Floors, Construction Year) of the matching buildings that overlap it. Since several sources may overlap the same target — sometimes only partially — we first select the combination that best fits the target's footprint. This optimal source set \(\mathcal{S}_a^*\) is the subset of the matching buildings \(\mathcal{B}_a\) whose combined shape maximizes the Intersection over Union (IoU) with \(a\):
where \(\mathcal{B}_a\) is the set of all matching source footprints for the target building \(a\), \(b_i\) denotes the footprint of source building \(i\), and \(\mathcal{S}\) is any possible combination of those footprints.
Numerical Attributes
-
Merge Aggregation: Building height, floors, and construction year are merged using intersection-area–weighted averages, so that larger overlaps contribute more.
\[v_a = \frac{\sum_{i \in \mathcal{S}_a^*} w_i \, v_i}{\sum_{i \in \mathcal{S}_a^*} w_i}\]where \(v_i\) is the value from source footprint \(i\), and \(w_i = \text{Area}(a \cap b_i)\) is its area of intersection with the target footprint \(a\).
-
Confidence Scores: For numerical merges, we report the spread of contributing values as a lower and upper confidence bound — the smallest and largest values among the merged sources:
\[\text{Confidence}_\text{lower} = \min(v_i), \qquad \text{Confidence}_\text{upper} = \max(v_i)\]taken over all source footprints \(i\) in the optimal source set \(\mathcal{S}_a^*\).
Categorical Attributes
-
Merge Aggregation: Building types are assigned the dominant category \(c^\ast\) — the category covering the largest cumulative intersecting area.
\[c^\ast = \arg\max_{c \in \mathcal{C}} \sum_{i:\, c_i = c} \text{Area}(a \cap b_i)\]where \(\mathcal{C}\) is the set of possible building categories, \(c_i\) is the category of source building \(i\), and the sum runs over the footprints in \(\mathcal{S}_a^*\) whose category equals \(c\).
-
Confidence Scores: The confidence score is the spatial agreement (Intersection over Area) between the target and the source footprints that share the dominant category \(c^\ast\) — sources with a different category are excluded:
\[\text{Confidence} = \frac{\text{Area}\big(a \cap \bigcup_{i:\, c_i = c^\ast} b_i\big)}{\text{Area}(a)}\]where the union is taken over the source footprints sharing the dominant category \(c^\ast\).
Geometry Merging
Geometries are merged hierarchically based on the source priority.
- Block-Level Consistency: We select the best footprint representation for an entire building block from a single source.
- Avoiding Fragmentation: This prevents the "stitching together" of misaligned units from different sources, preserving the structural integrity of the building representation.
-
We drop the smaller building since, in many cases, it represents a redundant building part or a sub-structure with special characteristics (e.g., a chimney or tower) that is already accounted for by the larger footprint. ↩